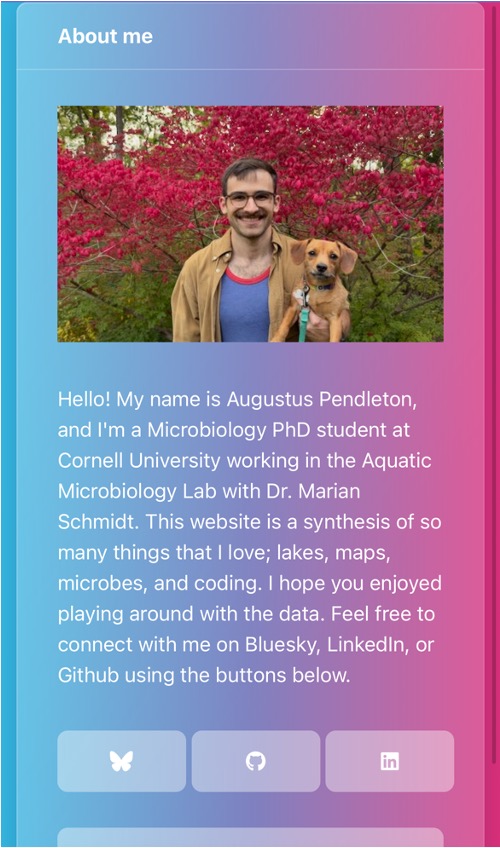
MicrobeMapper: Interact with our Lake Ontario data
Our lab synthesizes a wide variety of data, including environmental data like water quality and weather conditions, microbiological data from DNA sequencing and flow cytometry, and genetic predictions from bioinformatic pipelines. We’ll typically spend months working with these data, crafting them into a story that can be shared as a journal article or conference presentation. For example, you can read our most recent preprint on Lake Ontario’s microbes!
However, these classic academic outputs have their downsides: they can take a long time to publish, they may be behind paywalls, and they are often written for a specialized audience. What’s more, a single dataset often contains many more “stories” than can be shared in a single article, and other researchers, depending on their expertise and experience, will formulate hypotheses that would not even occur to us.
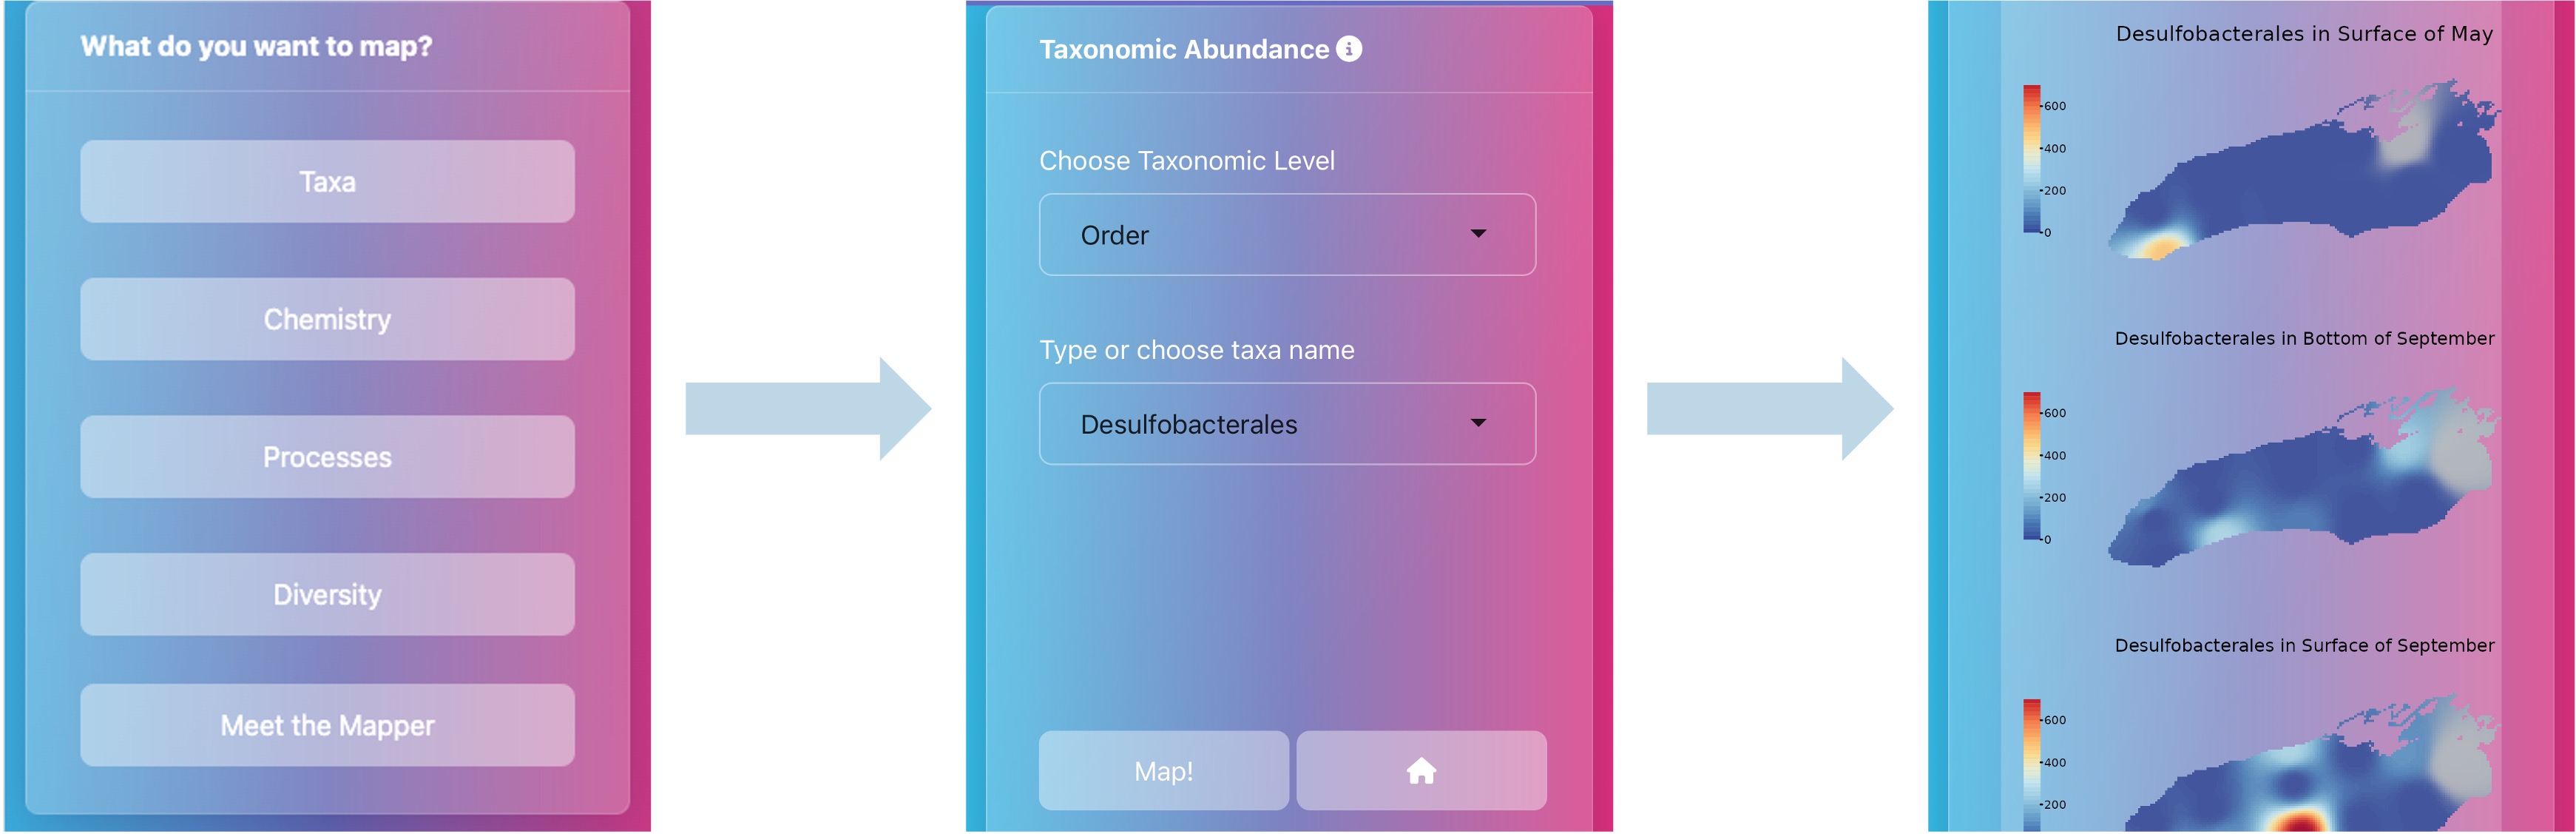
With that in mind, Gus wanted to create an alternative output for the data we collected during the 2023 Cooperative Science Monitoring Initiative (CSMI) cruises with the EPA: thus was born MicrobeMapper. MicrobeMapper is an interactive website, written entirely in R, which allows anyone to access and visualize spatial trends in our data. Using MicrobeMapper, you can look at the spatial and temporal trends of water quality, microbial taxonomic abundance, microbial richness, and predicted biogeochemical functions across Lake Ontario in May and September. This allows you to ask your own questions, engage in environmental microbiology, and appreciate the complexity and richness of Lake Ontario’s microbial communities.
We hope you enjoy MicrobeMapper, and if you find something interesting, feel free to let us know! (You can find Gus’s contact info on the “Meet the Mapper” tab)